Figures: Worth a thousand words
There’s a saying that pictures are worth a thousand words. But who wants to read a thousand words? To take this overly-literally, a typically estimate when editing is that (double-spaced) pages are 250 words each. That means that a picture is equivalent to reading 4 pages. Hot take here, but I don’t think anyone will complain about looking at a figure rather than reading four pages, but I think that figures are worth more than a thousand words.
I was taught to “communicate to the lizard brain”, which works off the premise that humans are emotional and instinctual beings and therefore you have to engage that part of them to elicit a response. When deciding when you like something, it’s rarely your intellectual side that engages, it’s the most primitive part of your brain, i.e. the lizard brain. This is why pictures are worth more than a thousand words, they can convey complex messages, and they engage the lizard brain more effectively than text.
During my degree, I was having a very difficult time communicating the temporal and spatial relationship between different cellular triggers of a bacterial process called sporulation. Sporulation is a process that certain bacteria will sense the end is nye, and transition into a dormant, but extremely-durable (near unkillable) state by a mitosis-like process, where instead of a daughter cell, a spore (ergo “sporulation”) is created. To microbiology nerds, this is pretty fascinating because this incredibly-complex process has been mapped back to a handful of triggers, in this case DNA transcription factors, that control the entire process. Cool science aside, I wrote and rewrote the section describing this, and it always turned out rambling and needlessly technical. Then my lizard brain said “draw a pretty picture”, so I did.
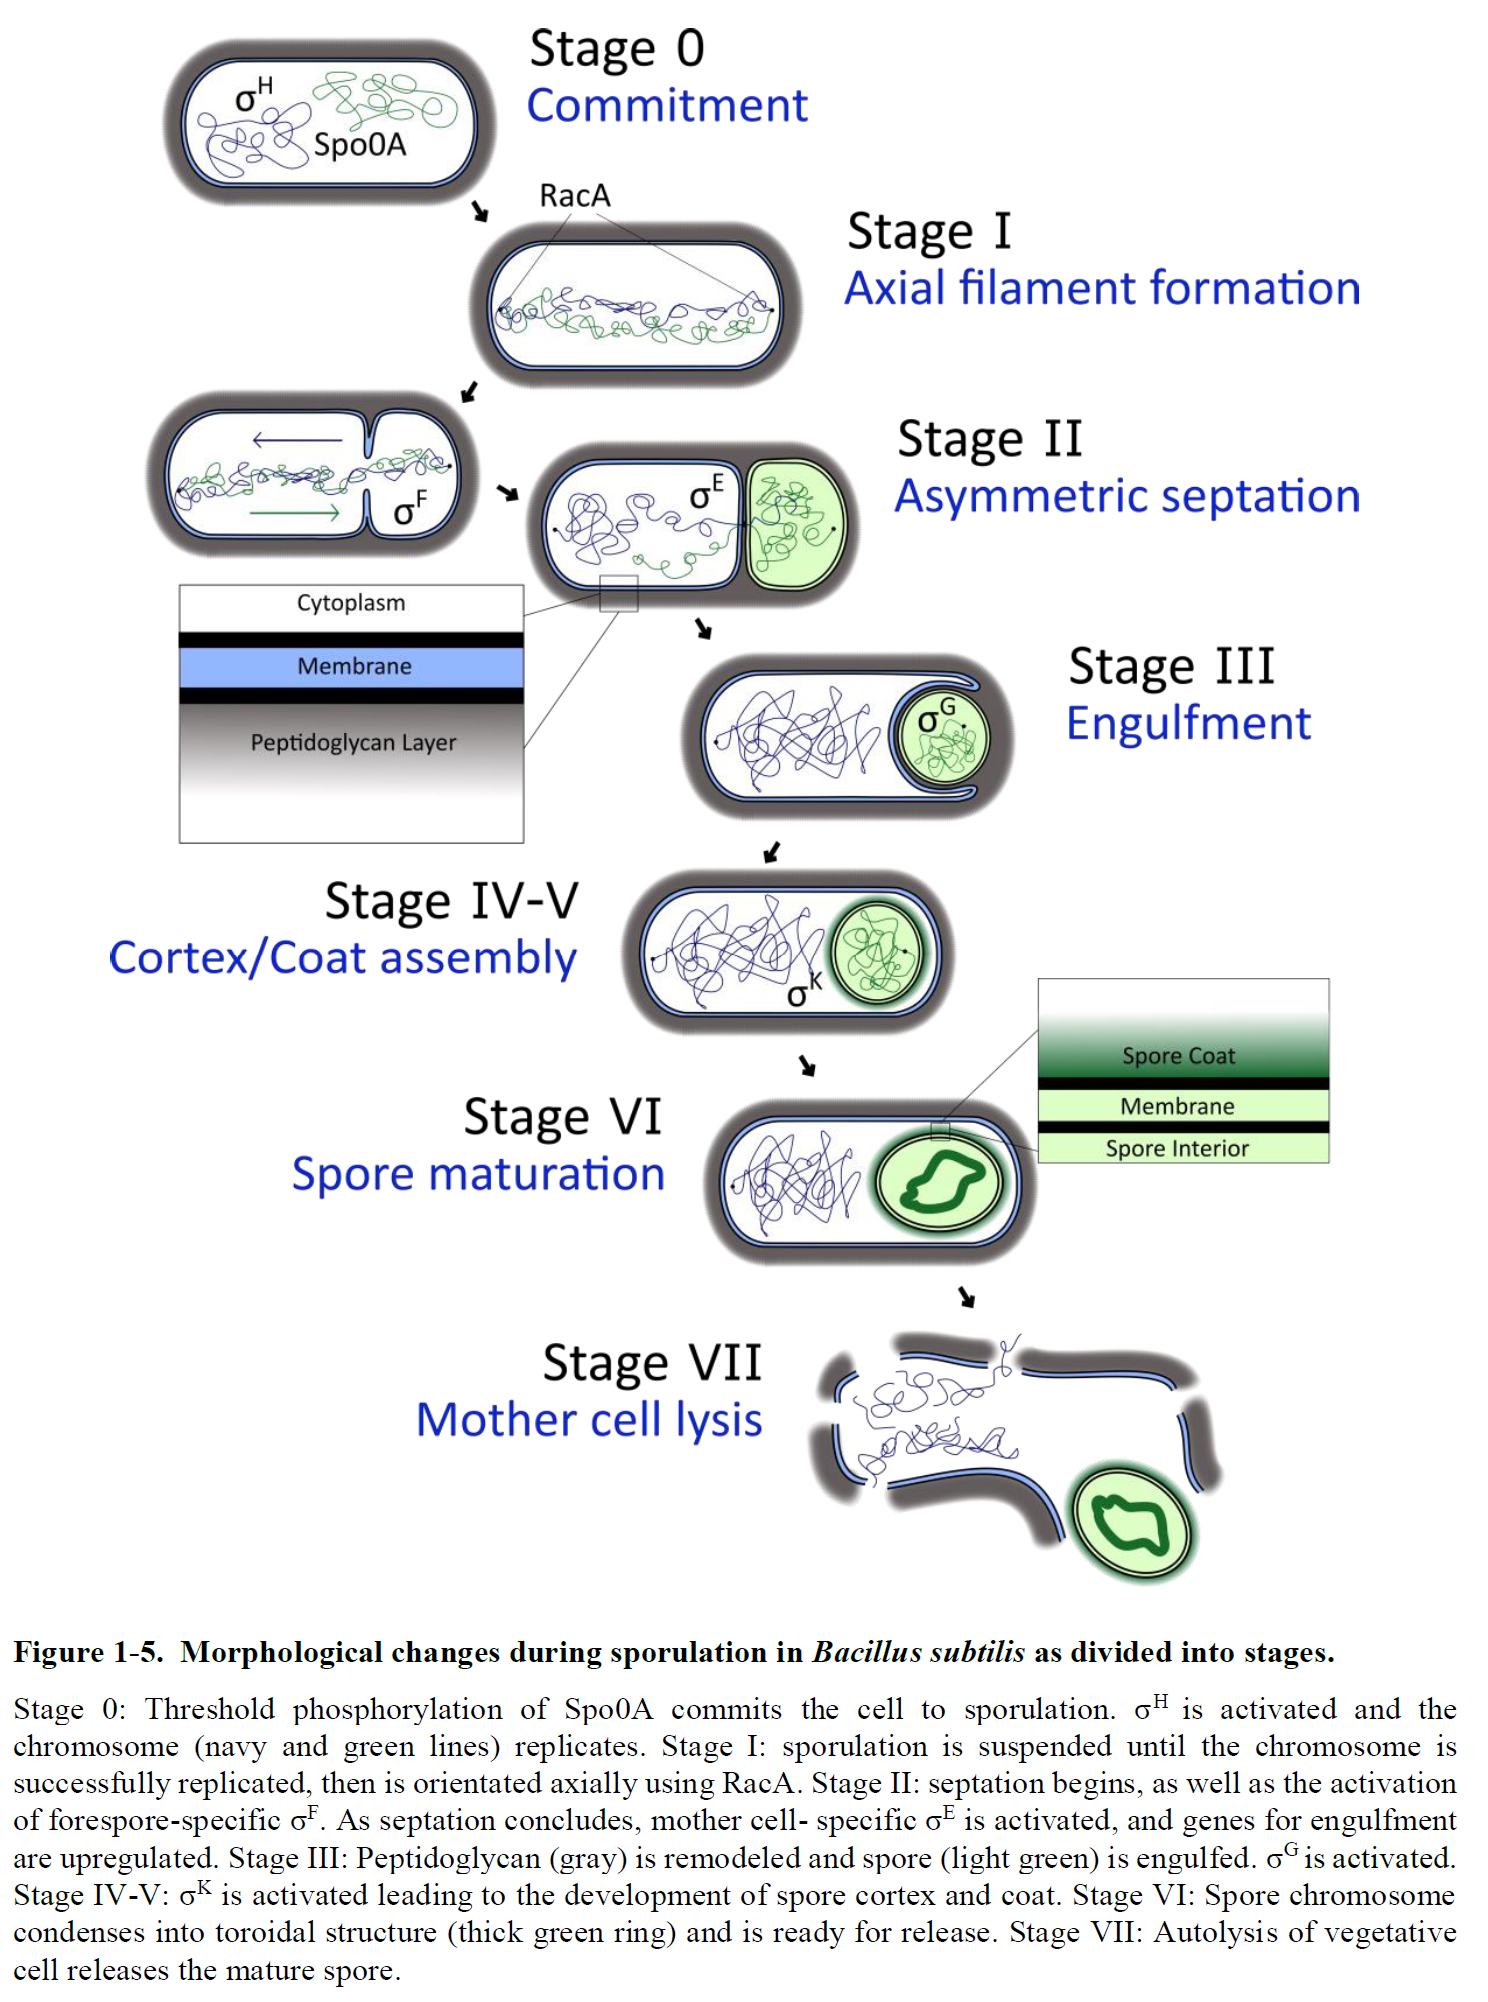
In the same space it took to write it originally, I had created a high-resolution image that demonstrated the segregation of each transcription factor (shown above in their “sigma form”, i.e. σ) as well as other information, like the DNA structural changes, and morphology.
The figure above was easy to make: It didn’t use any expensive software, and took under a day of work. That didn’t stop my reviewer asking where the citation was for the figure (assuming that I hadn’t made it), but that’s kind of like a compliment right?
Either way, sometimes the best writing is not text, let pretty pictures enrapture and inform your reader and you’ll both be better off. Learn to love and listen to the lizard brain.